Guest Article: This article was written by Kasper F. Pedersen of the Daisy research group at Aalborg University, Denmark, and is published here with permission from the author. Seagull is described in the IEEE MDM 2026 paper “Seagull: Data-Driven Maritime Traffic Analysis”.
Maritime data has received a lot of attention from the research community in recent years due to large open datasets being available. At the Daisy Research Group, Aalborg University, Denmark, we work with both theory and practice within the maritime domain. For the practice we have built the Seagull platform for making AIS data accessible through various layers:
- A vessel position history layer
- A filterable aggregated quadkey grid layer
- A filterable aggregated half-degree grid layer
- A vessel trajectory history layer
The platform is developed in collaboration with the Danish Geodata Agency as part of the Digital Research Centre Denmark (DIREC) initiative. Seagull is generally useful for anyone where historical movement on the water is of interest. As of the time of writing (September 2026), Seagull stores more than 18.7 billion Automatic Identification System (AIS) records from more than 126,400 ships.
Challenges
The research group behind Seagull is a happy and long-time user of PostgreSQL. Therefore, many prior projects have been based on PostgreSQL for data management. Seagull started out building on top of PostgreSQL as well; however, we quickly found out that it required many pre-aggregated tables in order to scale to the data volumes available. Maintaining such aggregation tables increases the amount of work we have to put into data pipelining.
The Solution
To solve the scaling issues while keeping a sleek and simplistic data pipeline, the research group decided to try out DuckDB. We were stunned by the performance and the low disk footprint delivered by DuckDB. However, there was one major problem: DuckDB is an in-process, multi-read, single-write OLAP database, hence only one process can write data at a time. Our platform relies on many different components, such as Apache Airflow for data pipelining, MapLibre Martin for serving vector tiles, and a web app for presenting the data to the end user. Having access to the data via only one process was not going to cut it.
GizmoSQL to the Rescue
It was clear that we needed some kind of wrapper to limit the access to the database file. This is exactly where GizmoSQL came into the picture. GizmoSQL allowed us to use DuckDB as if it was a centralized database. GizmoSQL gives access to DuckDB over the Arrow Flight SQL protocol. This means that only one process had to access the database file while several connections were able to query the database. Also, ingestion remained fast due to the work done by the GizmoData team in the ADBC driver space. Now it was time to build the Seagull platform!
The Seagull Platform
Everything served by the Seagull web application is processed online. Therefore, no pre-aggregation is happening; however, Martin caches already-served tiles to reduce compute. Tiles are generated utilizing the MVT functionality available in DuckDB. This eliminates the need to pre-compute tile files such as PMTiles and MBTiles.
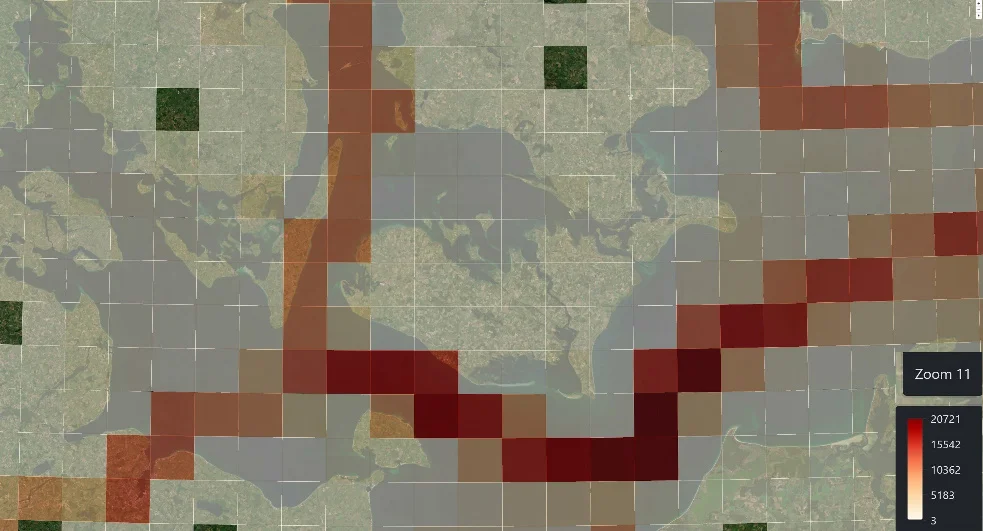
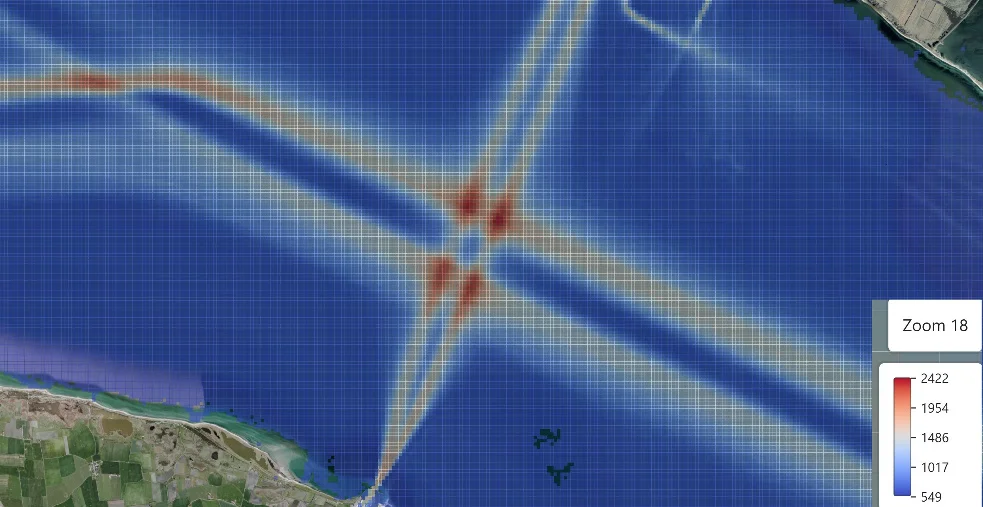
Figure 1 shows the quad grid at zoom level 11, which gives a coarse aerial overview of the amount of vessels moving through the grid cells. Compared to Figure 1, Figure 2 shows a more detailed overview at zoom level 18.
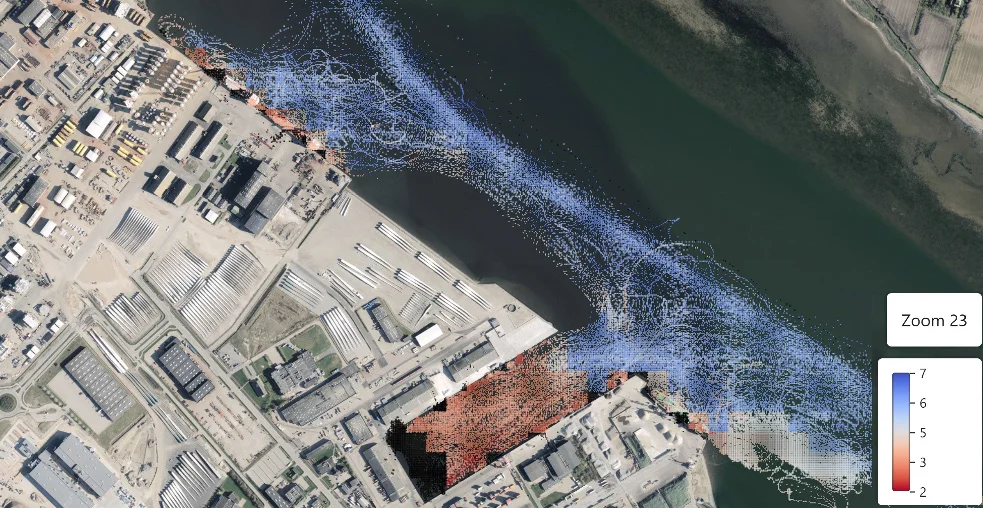
Where Figure 1 and Figure 2 focus on the vessel count feature, Figure 3 highlights the under keel clearance (meters of water below the keel). Figure 3 is at the finest zoom level, 23 (about 2.1 m² per cell), which is useful for narrow passages or congested areas such as harbors. All data is presentable from zoom level 1 to 23 and is processed per request.
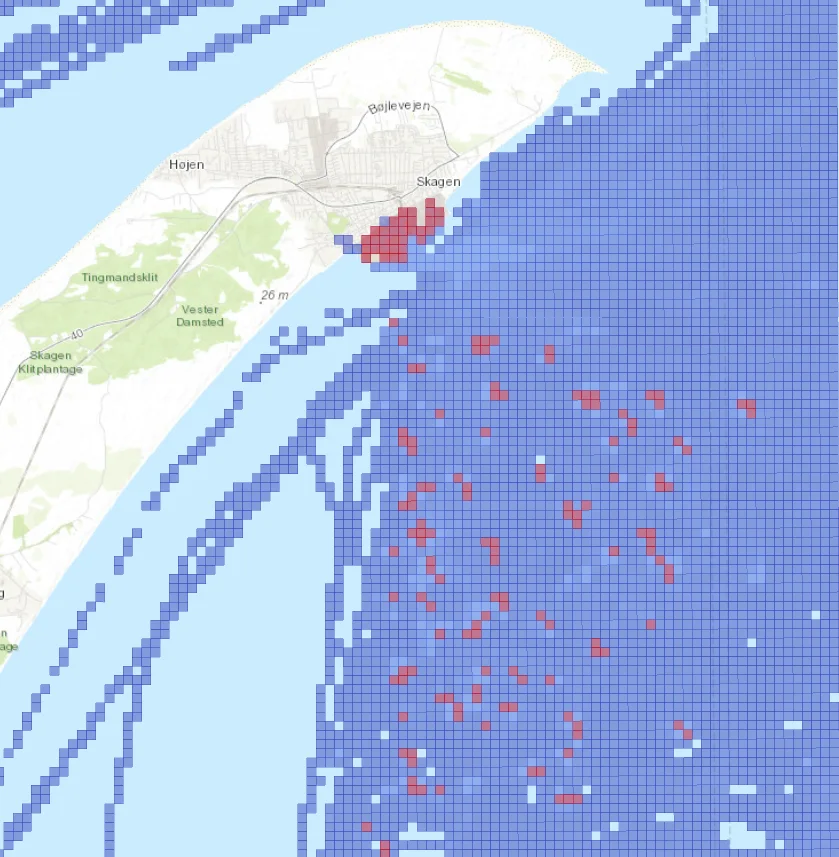
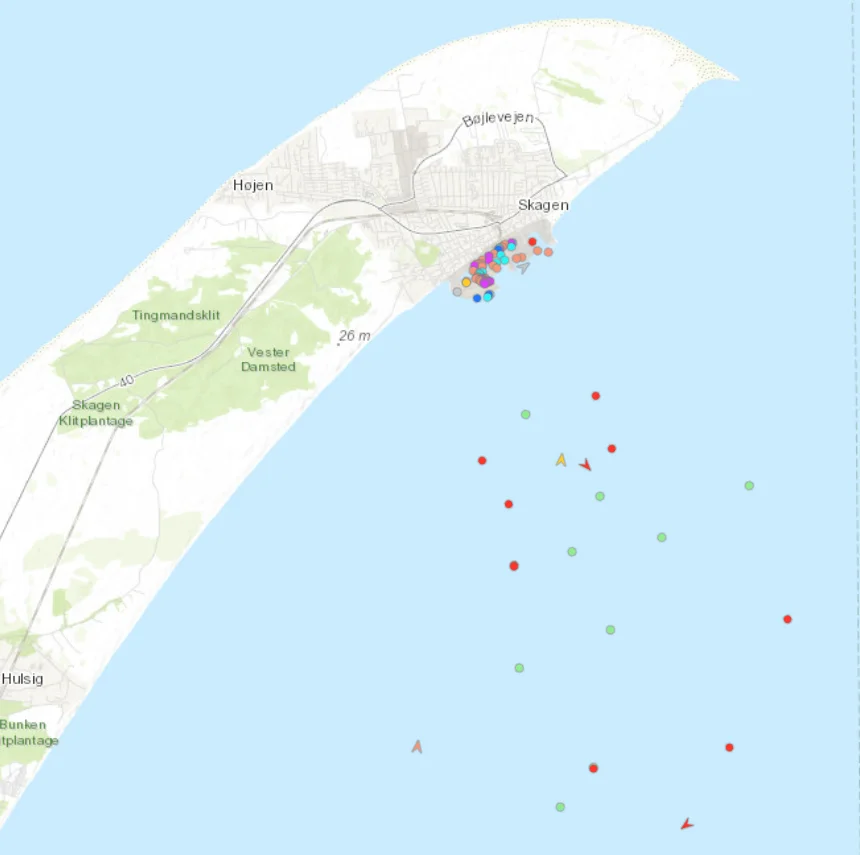
Figure 4 and Figure 5 illustrate the same area, but in two different formats. Figure 4 highlights where vessels are stationary. The metric is defined by the daily unique vessel seconds spent in each cell; the accumulative timeframe is 5 days. Figure 5 shows a snapshot of how vessels were positioned on 2026-09-04 at 08:36 AM. Circles are stationary vessels and arrows are moving vessels, with the course over ground represented by the tilt of the arrow. The color coding is based on the vessel type.
Wrapping Up
The Seagull platform is benefiting from the centralization of DuckDB which GizmoSQL provides. This has allowed us to design a system with a relatively simple data schema. The schema requires minimal maintenance while still resulting in a responsive and performant platform. For more implementation details about the Seagull platform, please read our paper.
From the GizmoData team: Seagull is a great example of the pattern GizmoSQL was built for: keep DuckDB’s single-file simplicity, and put an Arrow Flight SQL server in front of it so pipelines, tile servers, and apps can all share one database. If you are building something similar, install GizmoSQL Core for free, or talk to us about running it in production.